The key to Hall of Fame analysis is not necessarily in the best answers to the questions, but the questions themselves. In our last edition, we saw that Jack Morris could charitably be called a negative outlier. In other words, his credentials alone do not match those of a typical Hall of Famer. Whatever we may think of his enshrinement, he is not a good example of what a pitcher needs to do to get into the Hall of Fame.
This becomes important because of the way most people phrase the question. They get to individual players and ask whether they are a Hall of Famer. It’s a perfectly normal impulse, but that impulse ends up creating mistakes. It forces answers like, “well he is better than Jack Morris and if Morris is a Hall of Famer…” You get the idea. So, we are doing the same thing with pitchers that we did with position players. We are looking for the top two players not in the Hall of Fame.
The only way the Hall of Fame gets more representative of the actual best in the history of the sport is if we continually focus on the best players on the outside looking in. Being the best on the outside doesn’t mean you definitely belong, but it is a good place to start and a better place to start than simply picking a random player out of a hat.
1980-2000 HOF Index
| BWAR | FWAR | BWAR10 | FWAR10 | Index | |
|---|---|---|---|---|---|
| Roger Clemens | 139.2 | 133.9 | 86.1 | 80.7 | 439.7 |
| Curt Schilling | 79.6 | 79.8 | 64.9 | 63.5 | 289.8 |
| Kevin Brown | 67.8 | 76.6 | 57.9 | 61.7 | 263.9 |
| David Cone | 62.3 | 56.0 | 51.5 | 47.7 | 217.5 |
| Bret Saberhagen | 58.9 | 66.3 | 51.7 | 44.3 | 210.2 |
| Dwight Gooden | 53.0 | 56.7 | 46.1 | 52.5 | 208.3 |
| Chuck Finley | 57.9 | 56.9 | 48.6 | 44.1 | 207.5 |
| Kevin Appier | 54.5 | 50.8 | 52.8 | 46.4 | 204.5 |
| Dave Stieb | 56.4 | 43.8 | 54.3 | 40.0 | 194.5 |
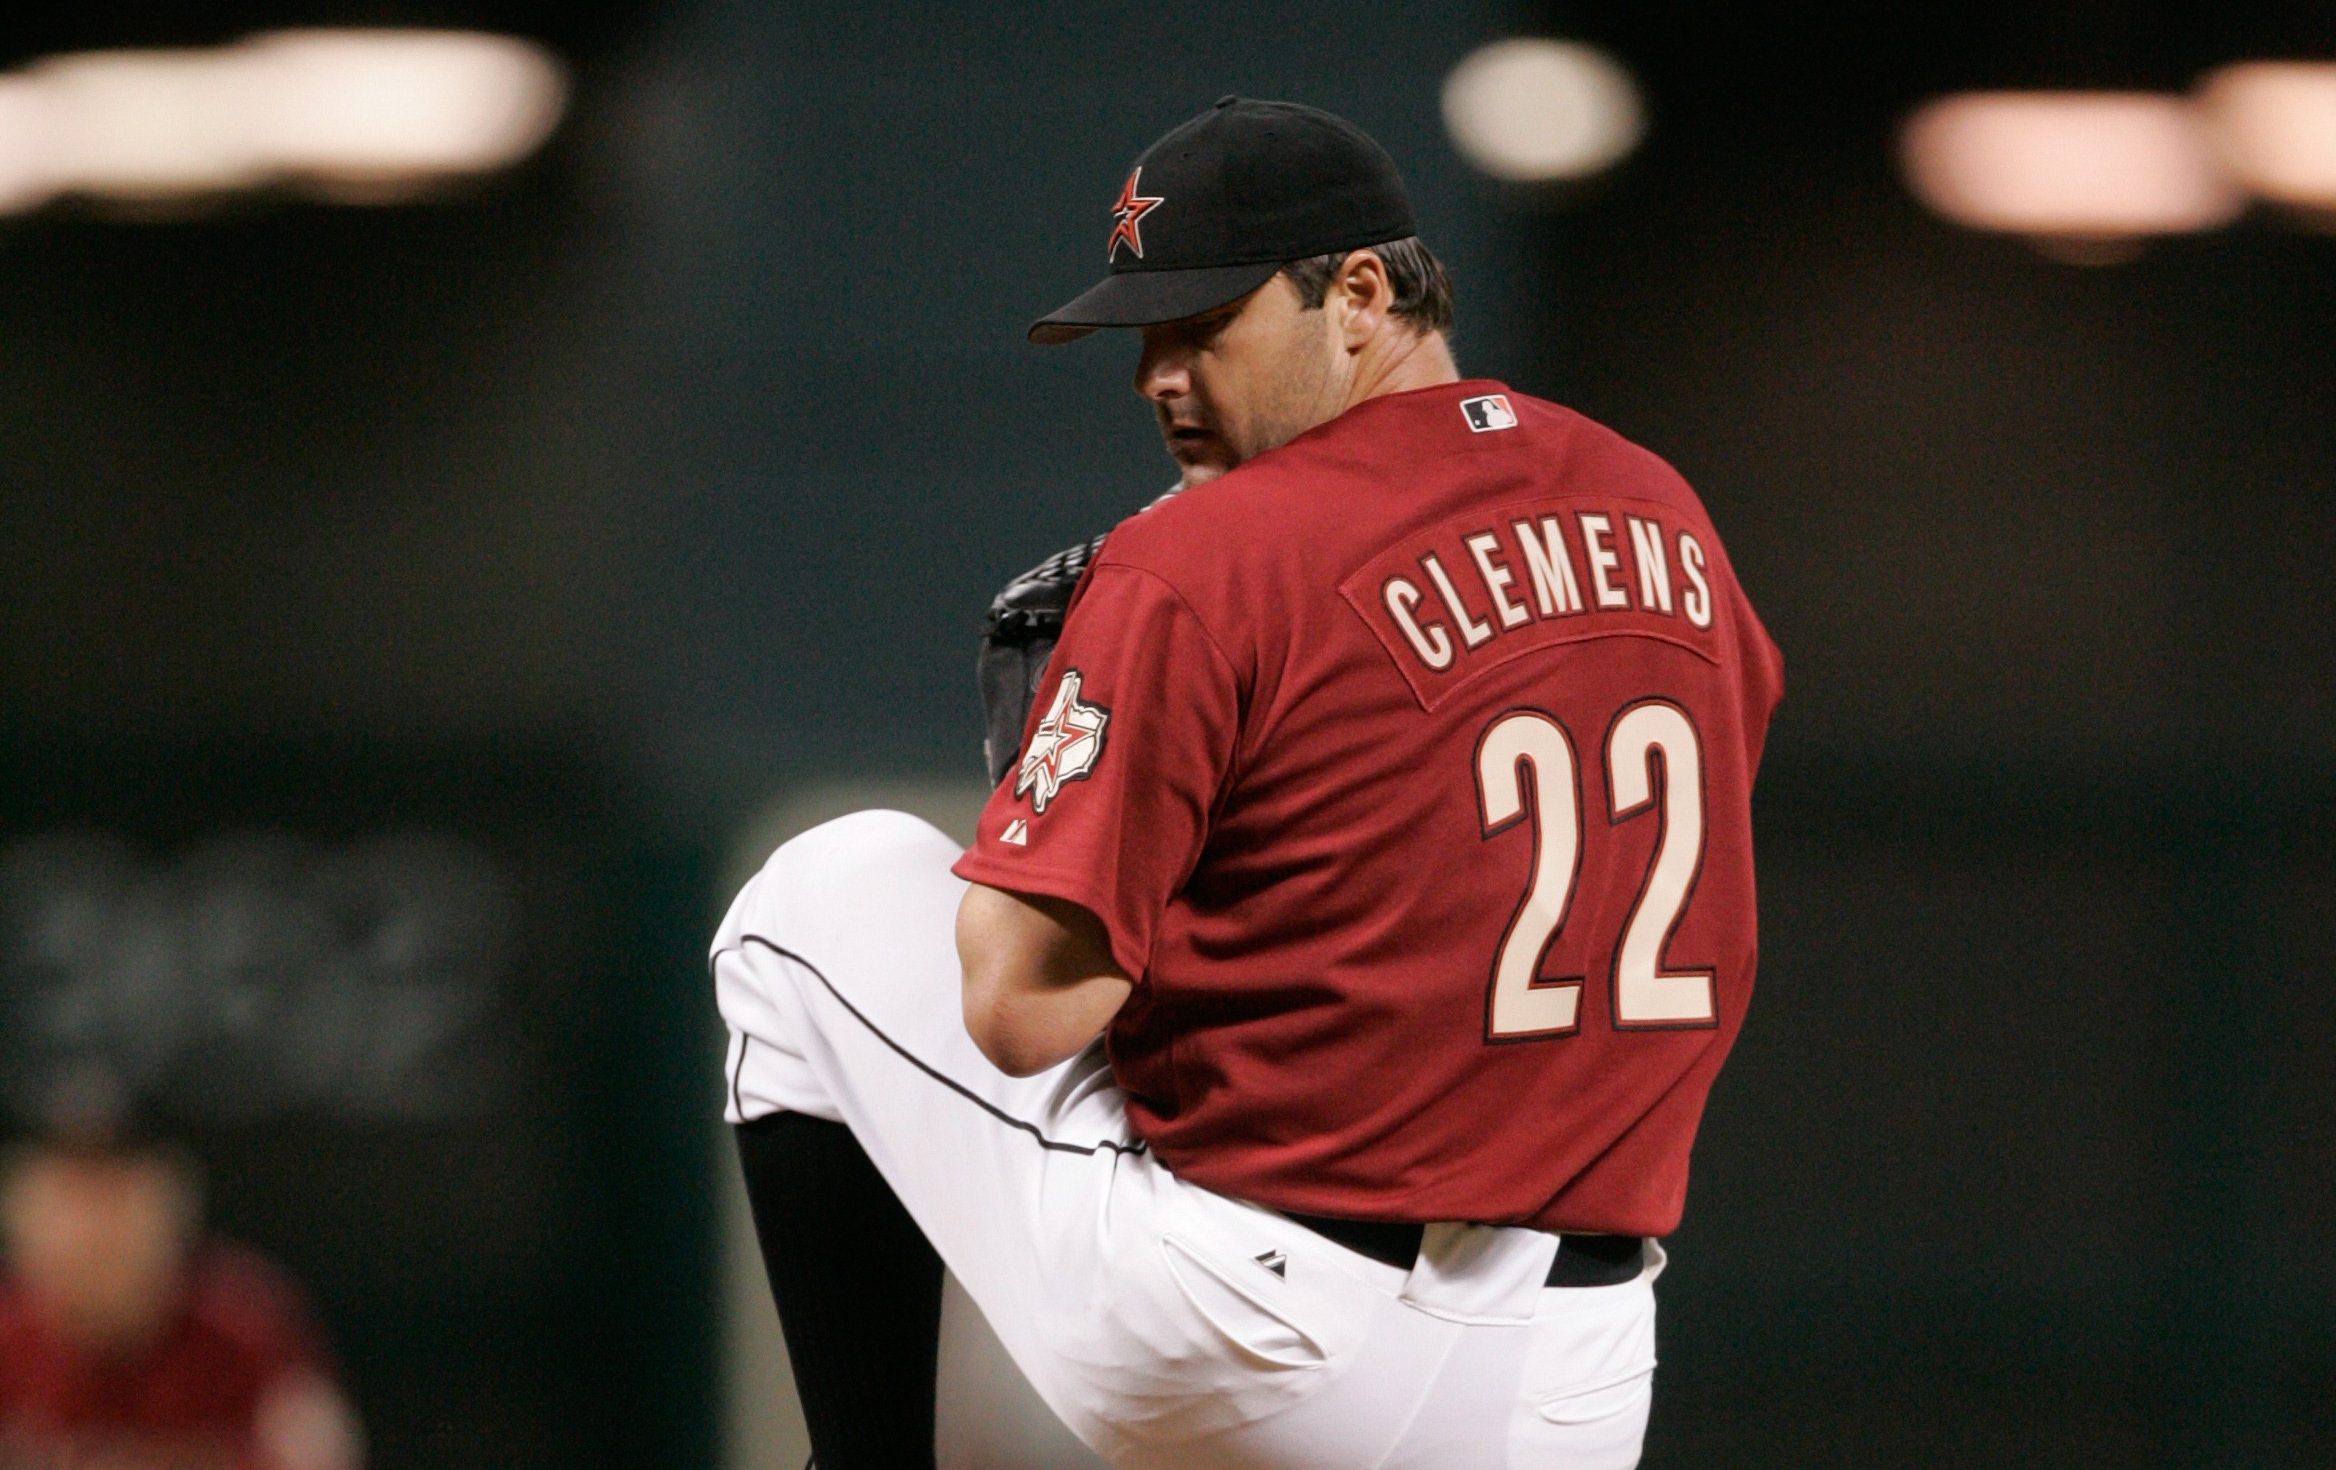
The index itself makes things a lot easier than you’d probably think. It is designed to put players into similar groups. We see that Clemens is by himself (and historically as well) and then you get a group of Schilling and Brown. The others clump in below that. So, the remaining question is how exactly do we treat Roger Clemens? Some would throw him out of the list for being a cheater. Others want to force us to acknowledge that he is best living pitcher.
It’s not an easy question to answer. I have vacillated on both sides of the debate for years and even now the conclusion is not a clean one. When did he start using? How long did he use? What effects did it have on his career? We do have to acknowledge that he denies any wrongdoing, but there isn’t a dedicated fan or baseball historian that takes such claims seriously.
This is dreadfully important to Kevin Brown. If we throw Clemens out then Schilling and Brown are the next two down the line. If we don’t then we suddenly start comparing Schilling and Brown to see who gets the next spot. I tend to put Clemens in the same category as Barry Bonds. He reportedly starting using in the mid 1990s and by then he already had two Cy Youngs to his credit. It is highly likely that he would have gotten in on his own merits with a normal career arc. Would he have been the best pitcher of all-time? Likely no, but that is where we are.
This is yet the 100th gentle reminder that the index was not meant to rank order players. I’m not staking whatever reputation I have on saying that Bret Saberhagen was better than Doc Gooden. They are damn close, so we need to look at some other numbers to make that final determination. So, we include some sabermetric pitching numbers, awards voting numbers, and playoff performance to help us make that call.
Sabermetric Pitching Numbers
| ERA+ | BPO | WaaPCT | NW | QS% | |
|---|---|---|---|---|---|
| Roger Clemens | 143 | 0.571 | 0.632 | 340 | 66 |
| Curt Schilling | 137 | 0.576 | 0.595 | 215 | 66 |
| Kevin Brown | 127 | 0.565 | 0.583 | 207 | 66 |
| David Cone | 121 | 0.628 | 0.579 | 185 | 61 |
| Bret Saberhagen | 126 | 0.568 | 0.592 | 168 | 60 |
| Dwight Gooden | 111 | 0.624 | 0.556 | 170 | 61 |
| Chuck Finley | 115 | 0.661 | 0.554 | 207 | 57 |
| Kevin Appier | 121 | 0.628 | 0.574 | 176 | 59 |
| Dave Stieb | 122 | 0.591 | 0.569 | 178 | 60 |
It is probably not a coincidence that quality starts were a Scott Boras invention. He was representing Kevin Brown at the time and noticed that he went six or more innings a lot and gave up three runs or fewer. Somehow, he didn’t win those games because the Orioles (Brown’s team at the time) were not a good baseball team. So, Boras was looking for any avenue he could to show how good his client was.
Similarly, I use bases per out (BPO) as a way to measure the damage a hitter causes or a pitcher allows. That stat pretty much splits this table into two groups. Maybe if I had come out with that stat earlier (I actually didn’t invent it) then Boras could have paid my way through college. No stat is perfect and BPO isn’t either. The one thing that waaPCT and neutral wins (NW) show is that wins and losses might be the least descriptive stat when it comes to judging pitchers. The waaPCT stands for thw weighted adjusted average winning percentage if a team was average in the field and at the plate. Most of these pitchers won more games than they should have. It shouldn’t shock anyone that the pitchers that look the best are those that pitched on the best teams.
The index showed Schilling and Brown were considerably better than the other pitchers and these numbers show the same thing. Their quality start percentage was identical to Clemens and the other numbers come closer to Clemens than the other pitchers come to Schilling and Brown. Usually, that would be enough but we also need to look at how they did in the Cy Young voting.
Awards Voting
| Vote | BWAR | Diff | Top | |
|---|---|---|---|---|
| Roger Clemens | 91 | 106 | −15 | 7 |
| Curt Schilling | 20 | 49 | −29 | 0 |
| Kevin Brown | 19 | 38 | −19 | 2 |
| David Cone | 28 | 38 | −10 | 1 |
| Bret Saberhagen | 25 | 33 | −8 | 2 |
| Dwight Gooden | 28 | 26 | 2 | 2 |
| Chuck Finley | 3 | 21 | −18 | 0 |
| Kevin Appier | 5 | 30 | −25 | 1 |
| Dave Stieb | 16 | 48 | −32 | 3 |
One of the things I did in both books was a series in every chapter I would call the “what about…” section. It involved players that weren’t necessarily a part of the initial group on the outside looking in, but were fan favorites that ended up getting a deeper look. Dave Parker and Gil Hodges are examples. Neither deserved to get in based on their credentials. but fans asked the question “is he a Hall of Famer?” instead of asking “is he the most qualified player not in?”
Dave Stieb is a part of that group. These numbers show he was the least appreciated pitcher of his time. The vote points are weighted based on how high they finished in the final Cy Young vote. The BWAR points represent where he actually finished in the league in BWAR. According to that, he was the best pitcher in the AL three times. Had he won even one Cy Young award he may have gotten more consideration.
I like Stieb, but I can’t in good conscience leapfrog eight other guys because he was shafted in the Cy Young votes. As you can see, most of them were under-appreciated as well. These tests are further proof that Schilling and Brown come in above the rest and that is assuming we completely bypass Clemens for moral and ethical reasons.
Pitcher Playoff Performance
| INN | W-L | ERA | SO | |
|---|---|---|---|---|
| Roger Clemens | 199.0 | 12-8 | 3.75 | 173 |
| Curt Schilling | 133.1 | 11-2 | 2.23 | 120 |
| Kevin Brown | 81.2 | 5-5 | 4.19 | 71 |
| David Cone | 111.1 | 8-3 | 3.80 | 94 |
| Bret Saberhagen | 54.0 | 2-4 | 4.67 | 38 |
| Dwight Gooden | 79.0 | 0-4 | 3.97 | 49 |
| Chuck Finley | 22.0 | 1-2 | 4.50 | 19 |
| Kevin Appier | 32.0 | 0-2 | 5.34 | 33 |
| Dave Stieb | 31.2 | 1-3 | 4.26 | 28 |
If one wanted to use a positive euphemism to describe the Hall of Fame process they would call it either idiosyncratic, enigmatic, or maybe even esoteric. It certainly isn’t systematic or logical. Curt Schilling is an asshole. There are really no two ways around that. His post baseball career has been marred with bankruptcy and controversial statements that paint him as an intolerant jackass. He is probably the one guy on this list that I wouldn’t want to drink a beer with.
I can only assume that personality didn’t come out of nowhere after his playing career. Like Jeff Kent before him, I’m guessing one of the reasons why he is still on the outside looking in is that the voters simply didn’t like him. The same could be true of Kevin Brown to a lesser extent. Voters will point to the character clause in the balloting process and that’s fine, but neither pitcher was a criminal. They just weren’t liked.
Schilling’s postseason record makes his candidacy a slam dunk. At least it should have. I’m not usually one to lean to heavily on playoff numbers. Most of these guys didn’t get ample enough opportunities, but the ones that did made the most of them. Like Jack Morris before them, playoff performance isn’t measured in numbers. It is measured in moments. Brown was untouchable through 1998. Schilling had 2001 and 2004. Those should have been more than enough to get these guys through.
Some of the others deserve some attention, but they need to wait in line behind Schilling and Brown. Skipping the line is what causes inferior players to get in and superior players to languish for decades for reasons that boggle the imagination. Let’s keep this simple. Schilling and Brown go first and then we start looking at the rest.
Originally published in Thoughts from A Native Texan on June 28, 2026. Feature photo from @astros on X, Source Link (cropped).